When a cyber attack occurs, there are pieces of evidence that point to the source. In a cyber attack, evidence includes things like phishing emails, IP addresses, and domain names. With this evidence, analysts develop threat intelligence that can be used to identify future malicious activity. The standard approach to managing this threat intelligence is to keep a list of problematic technical artifacts in a text file or spreadsheet.
 In the event of a repeat attack, an analyst might run a query to search for similarities to a previous attack. This method for data analysis is extremely limiting. For example, a domain might be listed, but whether it is malicious could depend on how it is used. The analyst is at a huge disadvantage when a particular technical artifact can only be identified as malicious if seen in a specific context and that context does not exist — like when an email from a specific sender domain has a certain X-Mailer header. If security companies get an alert every time a single domain resurfaces, regardless of context, they waste a lot of time chasing false alarms.
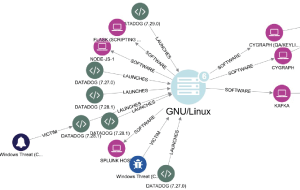
Combining indicators improves the detection process for security teams, reducing the number of unnecessary alerts they receive. Many so-called threats are actually benign, but they remain in the system, creating false positives, and obscuring actual malicious threats. Providing context through TruContext’s visualization allows users to prioritize threats and streamline the detection process. High-priority threats can be immediately identified. All security data is stored, so in the event that the IP address resurfaces, users can see that it was malicious in the past. This allows analysts to avoid spending time on distracting alerts and focus on developing a deeper understanding of attack patterns.
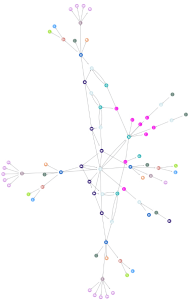
Cyber attacks are intentionally designed to look non-threatening and avoid suspicion. The discrete values of the technical artifacts can change rapidly in order to evade detection devices. Because of this, one isolated element doesn’t suffice as a good indication of an attack. Looking at the relationships between them, on the other hand, allows the analyst to understand the techniques, tactics, and procedures (TTPs) of an attacker. TruContext codifies the surfacing trends and creates predictive indicators for future threats.
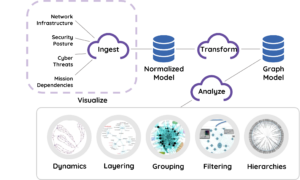
TruContext, using Machine Learning, draws on past events and threat intelligence to identify and prioritize threatening scenarios. By storing historical data in the form of a graph, instead of a list, TruContext creates a data structure that captures these complex relationships between elements.
Relationships between data elements are also enriched by temporal information. For example, a graph tracking an attack would store when a domain was registered, and the amount of time between when that domain was registered and when the phishing email was sent from it. That way, if another attack follows a similar pattern, it could be an indication that both incidents lead to one source. This helps analysts detect threats early and prevent attacks before they occur.
As relationships area mapped among all data elements, a more complete picture is produced of the patterns that cyber attacks follow. With this knowledge, institutions will be able to develop intelligent and comprehensive defense plans against major security threats.